Figure 4-2 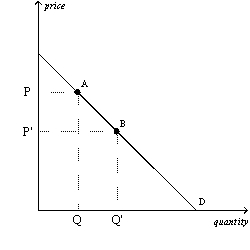
-Refer to Figure 4-2.The movement from point A to point B on the graph shows
A) a decrease in demand.
B) an increase in demand.
C) a decrease in quantity demanded.
D) an increase in quantity demanded.
Correct Answer:
Verified
Q90: A likely example of complementary goods for
Q93: A higher price for batteries would result
Q97: You wear either shorts or sweatpants every
Q104: Today's demand curve for gasoline could shift
Q107: Suppose the American Medical Association announces that
Q142: For teenagers,a 10 percent increase in the
Q220: Suppose you like to make,from scratch,pies filled
Unlock this Answer For Free Now!
View this answer and more for free by performing one of the following actions

Scan the QR code to install the App and get 2 free unlocks

Unlock quizzes for free by uploading documents