Figure 4-6 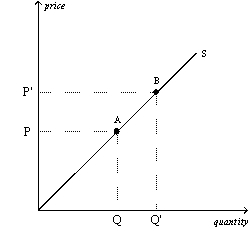
-Refer to Figure 4-6.The movement from point A to point B on the graph is caused by
A) a decrease in the price of the good.
B) an increase in the price of the good.
C) an advance in technology.
D) a decrease in input prices.
Correct Answer:
Verified
Q63: If suppliers expect the price of their
Q90: A decrease in the number of sellers
Q233: If the number of sellers in a
Q303: Which of the following might cause the
Q304: Which of the following would shift the
Q306: Recent forest fires in the western states
Q307: Today's supply curve for gasoline could shift
Q310: If car manufacturers begin utilizing new labor-saving
Q311: Funsters,Inc. ,the largest toy company in the
Q313: Figure 4-6 ![]()
Unlock this Answer For Free Now!
View this answer and more for free by performing one of the following actions

Scan the QR code to install the App and get 2 free unlocks

Unlock quizzes for free by uploading documents