Figure 4-6 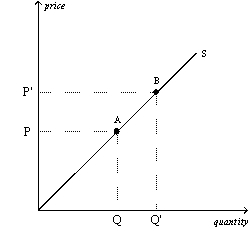
-Refer to Figure 4-6.The movement from point A to point B on the graph represents
A) an increased willingness and ability on the part of suppliers to supply the good at each possible price.
B) an increase in the number of suppliers.
C) a decrease in the price of a relevant input.
D) an increase in the price of the good that is being supplied and suppliers' response to that price change.
Correct Answer:
Verified
Q1: In markets,prices move toward equilibrium because of
A)the
Q26: Which of the following would cause price
Q30: A university's football stadium is never more
Q67: Today,producers changed their expectations about the future.This
Q275: A dress manufacturer recently has come to
Q316: An advance in production technology will
A) increase
Q317: An increase in the price of rubber
Q318: Which of the following is a determinant
Q324: Figure 4-7 Q325: At the equilibrium price,the quantity of the![]()
Unlock this Answer For Free Now!
View this answer and more for free by performing one of the following actions

Scan the QR code to install the App and get 2 free unlocks

Unlock quizzes for free by uploading documents