Figure 9-1
The figure illustrates the market for wool in New Zealand. 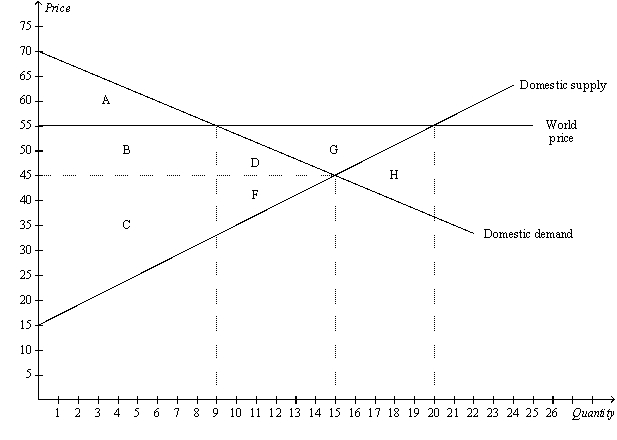
-Refer to Figure 9-1.When trade in wool is allowed,producer surplus in New Zealand
A) increases by the area B + D.
B) increases by the area B + D + G.
C) decreases by the area C + F.
D) decreases by the area G.
Correct Answer:
Verified
Q2: When a country allows trade and becomes
Q8: When a nation first begins to trade
Q20: Trade raises the economic well-being of a
Q81: Figure 9-1
The figure illustrates the market for
Q82: Figure 9-1
The figure illustrates the market for
Q85: Figure 9-1
The figure illustrates the market for
Q87: Figure 9-1
The figure illustrates the market for
Q121: When a country allows trade and becomes
Q128: When the nation of Duxembourg allows trade
Q137: When a country allows trade and becomes
Unlock this Answer For Free Now!
View this answer and more for free by performing one of the following actions

Scan the QR code to install the App and get 2 free unlocks

Unlock quizzes for free by uploading documents