Figure 10-10 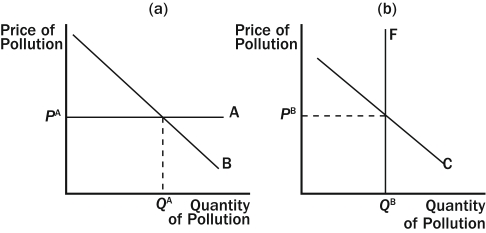
-Refer to Figure 10-10.Which graph illustrates a pollution permit program?
A) the left graph
B) the right graph
C) both graphs
D) neither graph
Correct Answer:
Verified
Q156: Suppose that cigarette smokers create a negative
Q174: Corrective taxes that are imposed upon the
Q177: Suppose that elementary education creates a positive
Q178: University researchers create a positive externality because
Q183: The difference between a corrective tax and
Q198: In some cases, tradable pollution permits may
Q246: Suppose that flu shots create a positive
Unlock this Answer For Free Now!
View this answer and more for free by performing one of the following actions

Scan the QR code to install the App and get 2 free unlocks

Unlock quizzes for free by uploading documents