Figure 10-10 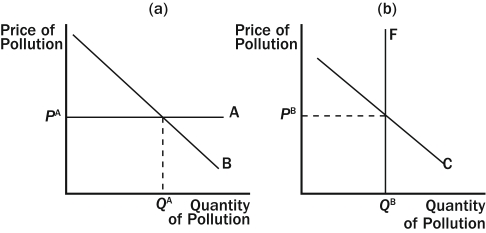
-Refer to Figure 10-10.Which graph illustrates a corrective tax?
A) the left graph
B) the right graph
C) both graphs
D) neither graph
Correct Answer:
Verified
Q162: Suppose that smoking creates a negative externality.
Q165: Suppose that alcohol consumption creates a negative
Q169: Suppose that electricity producers create a negative
Q172: Suppose that electricity producers create a negative
Q174: Corrective taxes that are imposed upon the
Q179: University researchers create a positive externality because
Q191: Which of the following statements is not
Q244: Suppose that flu shots create a positive
Q247: Figure 10-10 Q253: Suppose that cookie producers create a positive![]()
Unlock this Answer For Free Now!
View this answer and more for free by performing one of the following actions

Scan the QR code to install the App and get 2 free unlocks

Unlock quizzes for free by uploading documents