Figure 13-1
Suppose the production function shifts from TP1 to TP2. 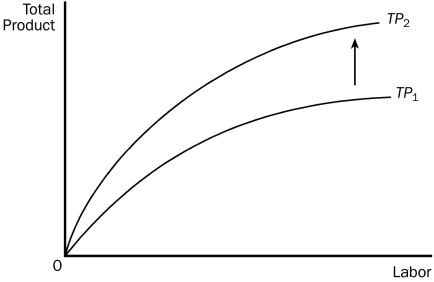
-Refer to Figure 13-1.In this diagram,the shift in the total product curve represents an increase in the firm's
A) costs of production.
B) productivity.
C) diseconomies.
D) market share.
Correct Answer:
Verified
Q139: Scenario 13-3
Tony is a wheat farmer,but he
Q140: The difference between accounting profit and economic
Q141: Table 13-1
Alyson's Pet Sitting Service

Q142: Scenario 13-5
Samantha has been working for a
Q143: Table 13-1
Alyson's Pet Sitting Service
Q145: Figure 13-1
Suppose the production function shifts from
Q147: Scenario 13-5
Samantha has been working for a
Q366: Which of these assumptions is often realistic
Q373: Assume a certain firm regards the number
Q394: For a firm, the production function represents
Unlock this Answer For Free Now!
View this answer and more for free by performing one of the following actions

Scan the QR code to install the App and get 2 free unlocks

Unlock quizzes for free by uploading documents