Figure 18-1.On the graph,L represents the quantity of labor and Q represents the quantity of output per week. 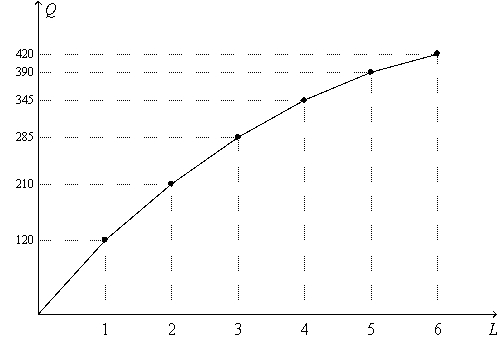
-Refer to Figure 18-1.Suppose the firm sells its output for $15 per unit,and it pays each of its workers $750 per week.When output increases from 210 units to 285 units,
A) the marginal cost is $10 per unit of output.
B) the marginal revenue is $5 per unit of output.
C) the value of the marginal product of labor is $4,275
D) the firm's profit decreases.
Correct Answer:
Verified
Q90: Figure 18-2.The figure shows a particular firm's
Q94: Figure 18-2.The figure shows a particular firm's
Q158: Figure 18-1 Q298: The term "factor market" applies to the Q345: Figure 18-1 Q367: Figure 18-1 Q368: Figure 18-1 Q369: Figure 18-1 Q379: Figure 18-1 Q537: The factors of production are best defined![]()
On the graph, L represents the
On the graph, L represents the
On the graph, L represents the
On the graph, L represents the
On the graph, L represents the
Unlock this Answer For Free Now!
View this answer and more for free by performing one of the following actions

Scan the QR code to install the App and get 2 free unlocks

Unlock quizzes for free by uploading documents