Figure 18-2.The figure shows a particular firm's value-of-marginal-product (VMP) curve.On the horizontal axis,L represents the number of workers.The time frame is daily. 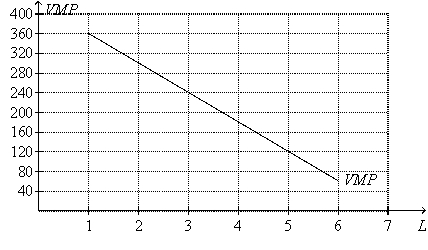
-Refer to Figure 18-2.Suppose one point on the firm's production function is
(L = 3,Q = 180) ,where L = number of workers and Q = quantity of output.If the firm sells its output for $5 per unit,then
A) a second point on the firm's production function is (L = 4,Q = 216) .
B) the firm's production function exhibits the property of diminishing marginal product of labor.
C) the firm will maximize profit by hiring four workers if it pays workers $160 per day.
D) All of the above are correct.
Correct Answer:
Verified
Q16: Because a firm's demand for a factor
Q81: Figure 18-2.The figure shows a particular firm's
Q85: Figure 18-2.The figure shows a particular firm's
Q89: Figure 18-1.On the graph,L represents the quantity
Q90: Figure 18-2.The figure shows a particular firm's
Q285: Economists refer to the inputs that firms
Q349: Figure 18-1
On the graph, L represents the
Q361: Figure 18-1
On the graph, L represents the
Q367: Figure 18-1
On the graph, L represents the
Q373: Figure 18-1
On the graph, L represents the
Unlock this Answer For Free Now!
View this answer and more for free by performing one of the following actions

Scan the QR code to install the App and get 2 free unlocks

Unlock quizzes for free by uploading documents