Figure 18-4
This figure below shows the labor market for automobile workers.The curve labeled S is the labor supply curve,and the curves labeled D1 and D2 are the labor demand curves.On the horizontal axis,L represents the quantity of labor in the market. 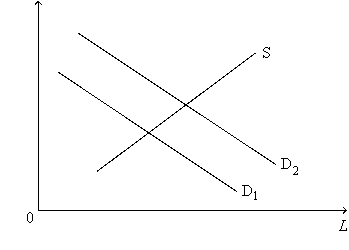
-Refer to Figure 18-4.What is measured along the vertical axis on the graph?
A) The quantity of automobiles produced
B) The price of automobiles
C) The wage paid to automobile workers
D) Time spent by workers producing automobiles
Correct Answer:
Verified
Q42: The labor supply curve reflects how
A) workers'
Q46: What happens to labor supply in the
Q181: What happens to the labor supply curves
Q242: Among the people who are characterized below,
Q250: If Emma's individual labor supply curve is
Q252: Suppose that the market for labor is
Q253: If workers respond to an increase in
Q255: Which of the following statements is correct?
Q262: Immigration of workers into the United States
Q279: Which of the following events would lead
Unlock this Answer For Free Now!
View this answer and more for free by performing one of the following actions

Scan the QR code to install the App and get 2 free unlocks

Unlock quizzes for free by uploading documents