Figure 18-4
This figure below shows the labor market for automobile workers.The curve labeled S is the labor supply curve,and the curves labeled D1 and D2 are the labor demand curves.On the horizontal axis,L represents the quantity of labor in the market. 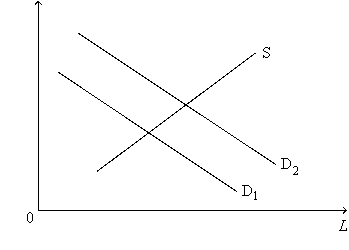
-Refer to Figure 18-4.Which of the following is a possible explanation of the shift of the labor-demand curve from D1 to D2?
A) The wage earned by automobile workers increased.
B) The price of automobiles increased.
C) The opportunity cost of leisure,as perceived by automobile workers,decreased.
D) Large segments of the population changed their tastes regarding leisure versus work.
Correct Answer:
Verified
Q190: When labor supply increases,
A)the marginal productivity of
Q274: Consider the market for university economics professors.Suppose
Q276: Which of the following correctly describes a
Q277: Suppose the following events occur in the
Q278: Consider the labor market for computer programmers.During
Q280: Suppose the following events occur in the

