Figure 18-4
This figure below shows the labor market for automobile workers.The curve labeled S is the labor supply curve,and the curves labeled D1 and D2 are the labor demand curves.On the horizontal axis,L represents the quantity of labor in the market. 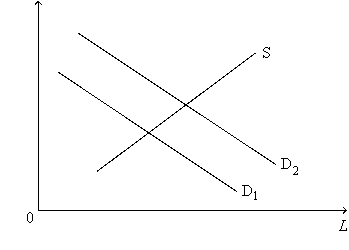
-Refer to Figure 18-4.Which of the following events would most likely explain the shift of the labor-demand curve from D1 to D2?
A) The price of automobiles decreased.
B) A large number of immigrants entered the automobile-worker market.
C) A technological advance increased the marginal product of automobile workers.
D) All of the above events are equally-likely explanations.
Correct Answer:
Verified
Q190: When labor supply increases,
A)the marginal productivity of
Q220: Consider the labor market for computer programmers.
Q268: Consider the labor market for heath care
Q269: Consider the labor market for computer programmers.During
Q270: Consider the labor market for heath care
Q271: Consider the market for university economics professors.Suppose
Q273: A significant slowdown in the growth of
Q274: Consider the market for university economics professors.Suppose
Q276: Which of the following correctly describes a
Q277: Suppose the following events occur in the
Unlock this Answer For Free Now!
View this answer and more for free by performing one of the following actions

Scan the QR code to install the App and get 2 free unlocks

Unlock quizzes for free by uploading documents