Multiple Choice
Figure 18-7 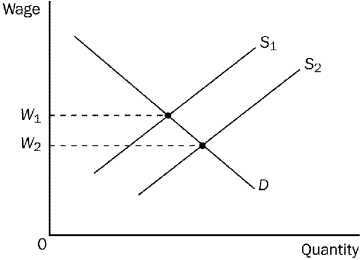
-Refer to Figure 18-7.The shift of the labor supply curve from S1 to S2 could possibly be explained by
A) a change in workers' attitudes toward the work-leisure tradeoff.
B) decreases in wages in other labor markets.
C) immigration of workers into the region or country.
D) All of the above are correct.
Correct Answer:
Verified
Related Questions
Q87: The owners of capital resources are compensated
Q93: The accumulation of machinery and buildings used
Q144: Scenario 18-4
In 1997, Albania experienced a civil
Q215: An increase in the value of the
Q217: If one were to consider a university

