Figure 20-1
Number of Poor 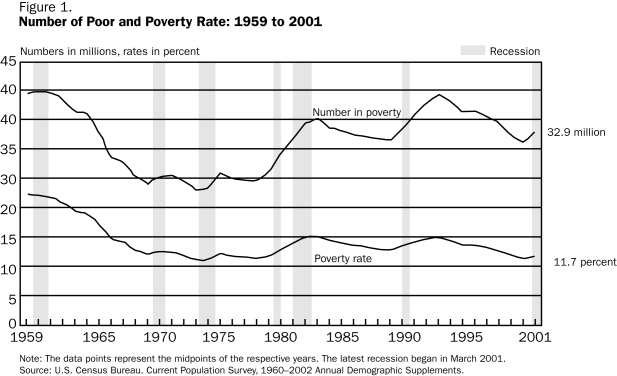
-Refer to Figure 20-1.Between 1965 and 2001,during recessions (the shaded bars) the number of individuals in poverty has
A) increased.
B) decrease.
C) not changed.
D) decreased and then increased.
Correct Answer:
Verified
Q147: Figure 20-2
Poverty Rates by Age 
Q148: Which of the following groups has the
Q149: Table 20-4
Poverty Thresholds in 2002,by Size of
Q150: Table 20-4
Poverty Thresholds in 2002,by Size of
Q151: Which of the following is not an
Q153: Which of the following is not correct?
A)
Q154: Figure 20-2
Poverty Rates by Age
Q155: Figure 20-2
Poverty Rates by Age
Q156: Table 20-4
Poverty Thresholds in 2002,by Size of
Q157: Table 20-4
Poverty Thresholds in 2002,by Size of
Unlock this Answer For Free Now!
View this answer and more for free by performing one of the following actions

Scan the QR code to install the App and get 2 free unlocks

Unlock quizzes for free by uploading documents