Multiple Choice
Figure 20-1
Number of Poor 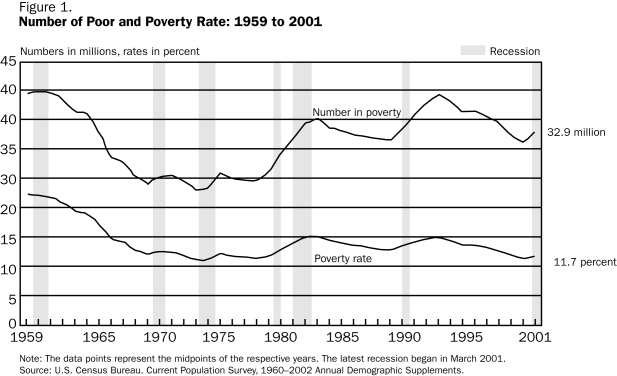
-Refer to Figure 20-1.Between 1959 and 2001 the poverty rate has
A) increased.
B) decreased.
C) stayed the same.
D) moved in the opposite direction of the number of people in poverty.
Correct Answer:
Verified
Related Questions
Q143: Suppose that a family saves and borrows
Q153: Government vouchers to purchase food, also known
Q154: Figure 20-2
Poverty Rates by Age 
Q155: Figure 20-2
Poverty Rates by Age
Q156: Table 20-4
Poverty Thresholds in 2002,by Size of
Q157: Table 20-4
Poverty Thresholds in 2002,by Size of
Unlock this Answer For Free Now!
View this answer and more for free by performing one of the following actions

Scan the QR code to install the App and get 2 free unlocks

Unlock quizzes for free by uploading documents