Figure 21-8 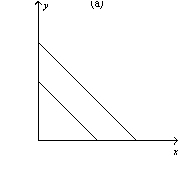
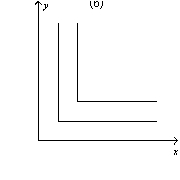
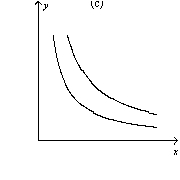
-Refer to Figure 21-8.Which of the graphs shown represent indifference curves for perfect substitutes?
A) graph a
B) graph b
C) graph c
D) All of the above are correct.
Correct Answer:
Verified
Q164: The following diagram shows one indifference curve
Q165: Figure 21-8 Q170: Figure 21-8 Q194: Consider the indifference curve map for nickels Q328: If an indifference curve is bowed in Q329: As long as a consumer remains on Q361: When two goods are perfect substitutes, the Q377: When two goods are perfect substitutes, the Q378: A consumer's preferences for $1 bills and Q380: Assume that a consumer's indifference curve is![]()
![]()
A)indifference
Unlock this Answer For Free Now!
View this answer and more for free by performing one of the following actions

Scan the QR code to install the App and get 2 free unlocks

Unlock quizzes for free by uploading documents