Figure 21-11 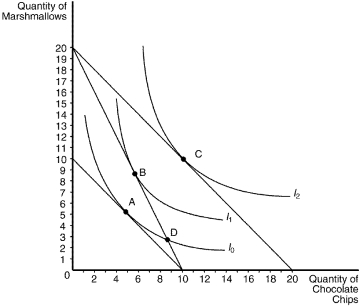
-Refer to Figure 21-11.Assume that the consumer depicted in the figure has an income of $40.Based on the information available in the graph,which of the following price-quantity combinations would be on her demand curve for marshmallows if the price of chocolate chips is $4?
A) P=$2,Q=3
B) P=$2,Q=9
C) P=$4,Q=3
D) P=$4,Q=9
Correct Answer:
Verified
Q178: Which of the following represents a consumer's
Q193: The consumer's optimal choice is the one
Q221: Figure 21-10 Q222: Jeffrey spends all of his income on Q224: Figure 21-11 Q225: Jane is maximizing total utility while consuming Q227: Figure 21-11 Q228: Amy spends all of her income on Q229: Figure 21-10 Q231: Figure 21-11 Unlock this Answer For Free Now! View this answer and more for free by performing one of the following actions Scan the QR code to install the App and get 2 free unlocks Unlock quizzes for free by uploading documents![]()
![]()
![]()
![]()
![]()

