Figure 26-3.The figure shows two demand-for-loanable-funds curves and two supply-of-loanable-funds curves. 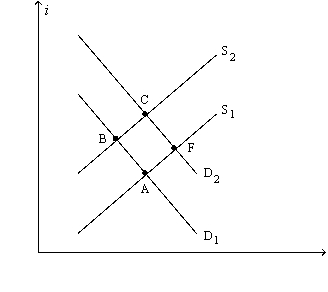
-Refer to Figure 26-3.Which of the following movements shows the effects of the government going from a budget deficit to a budget surplus?
A) a movement from Point A to Point B
B) a movement from Point B to Point A
C) a movement from Point A to Point F
D) a movement from Point C to Point B
Correct Answer:
Verified
Q91: A policy that induces people to save
Q93: Which of the following counts as part
Q94: If the government instituted an investment tax
Q97: In the market for loanable funds,the interaction
Q105: Figure 26-3.The figure shows two demand-for-loanable-funds curves
Q110: Figure 26-2.The figure depicts a supply-of-loanable-funds curve
Q114: Which of the following are effects of
Q225: Figure 26-3
The figure shows two demand-for-loanable-funds curves
Q372: Figure 26-3.The figure shows two demand-for-loanable-funds curves
Q385: If the budget deficit increases then
A) saving
Unlock this Answer For Free Now!
View this answer and more for free by performing one of the following actions

Scan the QR code to install the App and get 2 free unlocks

Unlock quizzes for free by uploading documents