Figure 30-1 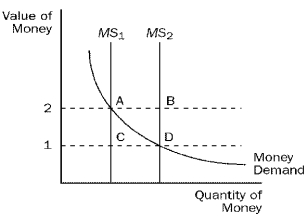
-Refer to Figure 30-1.When the money supply curve shifts from MS1 to MS2,
A) the demand for goods and services decreases.
B) the economy's ability to produce goods and services increases.
C) the equilibrium price level increases.
D) the equilibrium value of money increases.
Correct Answer:
Verified
Q27: When the money market is drawn with
Q28: When the money market is drawn with
Q41: When the money market is drawn with
Q42: When the money market is drawn with
Q45: Suppose the money market,drawn with the value
Q50: When the money market is drawn with
Q53: When the money market is drawn with
Q62: Consider the money market drawn with the
Q65: Figure 30-1 Q125: Figure 30-1 ![]()
![]()
Unlock this Answer For Free Now!
View this answer and more for free by performing one of the following actions

Scan the QR code to install the App and get 2 free unlocks

Unlock quizzes for free by uploading documents