Figure 30-2.On the graph,MS represents the money supply and MD represents money demand.The usual quantities are measured along the axes. 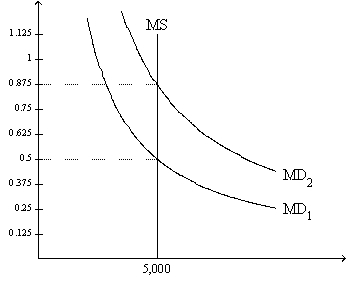
-Refer to Figure 30-2.At the end of 2007 the relevant money-demand curve was the one labeled MD2.At the end of 2008 the relevant money-demand curve was the one labeled MD1.Assuming the economy is always in equilibrium,what was the economy's approximate inflation rate for 2008?
A) -43 percent
B) -57 percent
C) 57 percent
D) 75 percent
Correct Answer:
Verified
Q48: In the fourteenth century,the Western African Emperor
Q67: When the money market is drawn with
Q72: Suppose there is a surplus in the
Q73: When the money market is drawn with
Q78: When the money market is drawn with
Q94: Figure 30-2.On the graph,MS represents the money
Q96: Figure 30-3.On the graph,MS represents the money
Q97: Figure 30-3.On the graph,MS represents the money
Q111: Nominal GDP measures
A)the total quantity of final
Q152: The price level is a
A)relative variable.
B)dichotomous variable
C)real
Unlock this Answer For Free Now!
View this answer and more for free by performing one of the following actions

Scan the QR code to install the App and get 2 free unlocks

Unlock quizzes for free by uploading documents