Figure 30-3.On the graph,MS represents the money supply and MD represents money demand.The usual quantities are measured along the axes. 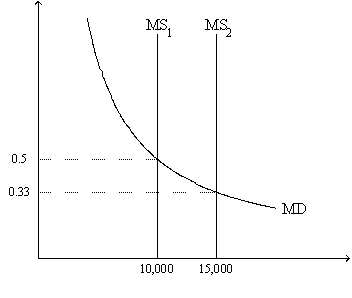
-Refer to Figure 30-3.At the end of 2007 the relevant money-supply curve was the one labeled MS1.At the end of 2008 the relevant money-supply curve was the one labeled MS2.Assuming the economy is always in equilibrium,what was the economy's approximate inflation rate for 2008?
A) -33 percent
B) 17 percent
C) 50 percent
D) 67 percent
Correct Answer:
Verified
Q83: Figure 30-2.On the graph,MS represents the money
Q84: Figure 30-2.On the graph,MS represents the money
Q86: Figure 30-3.On the graph,MS represents the money
Q87: Figure 30-2.On the graph,MS represents the money
Q93: On a given morning,Franco sold 40 pairs
Q109: The price of a Honda Accord
A)and the
Q150: Figure 30-3.On the graph,MS represents the money
Q152: Figure 30-2.On the graph,MS represents the money
Q153: Figure 30-2.On the graph,MS represents the money
Q154: Figure 30-3.On the graph,MS represents the money
Unlock this Answer For Free Now!
View this answer and more for free by performing one of the following actions

Scan the QR code to install the App and get 2 free unlocks

Unlock quizzes for free by uploading documents