Figure 35-5
Use the two graphs in the diagram to answer the following questions. 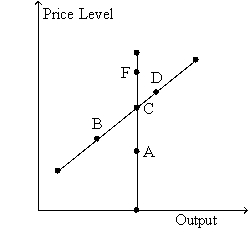
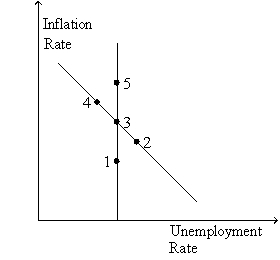
-Refer to Figure 35-5.Starting from C and 3,in the long run,an increase in money supply growth moves the economy to
A) A and 1.
B) back to C and 3.
C) D and 4.
D) F and 5.
Correct Answer:
Verified
Q76: If the long-run Phillips curve shifts to
Q79: If the long-run Phillips curve shifts to
Q93: An increase in expected inflation shifts
A)the long-run
Q159: Suppose that the central bank unexpectedly reduces
Q160: Figure 35-4
Use the graph below to answer
Q163: Figure 35-6
Use this graph to answer the
Q164: Figure 35-6
Use this graph to answer the
Q165: Figure 35-4
Use the graph below to answer
Q170: If the minimum wage increased, then at
Q172: A change in expected inflation shifts
A)the short-run
Unlock this Answer For Free Now!
View this answer and more for free by performing one of the following actions

Scan the QR code to install the App and get 2 free unlocks

Unlock quizzes for free by uploading documents