Saving-Investment Diagram -Based on the Saving-Investment Diagram,if the Difference Between Values G
Saving-Investment Diagram 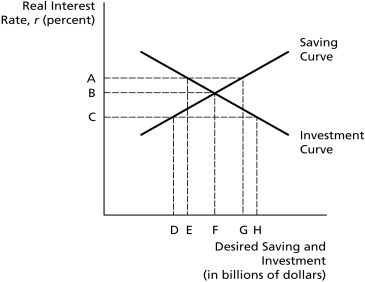
-Based on the Saving-Investment Diagram,if the difference between values G and E measures the net capital outflow,then ________.
A) the difference between values G and E measures the trade surplus
B) the difference between values H and D measures the trade surplus
C) the domestic real interest rate is indicated by B
D) desired saving has decreased
E) none of the above
Correct Answer:
Verified
Q41: Which of the following would lead domestic
Q42: Suppose consumption is $500 billion,investment is $120
Q43: In an economy open to international trade
Q44: Saving-Investment Diagram Q45: In a small open economy,goods market equilibrium Q47: Suppose an economy has a GDP of Q48: Suppose GDP is $800 billion,net taxes equal Q49: Saving-Investment Diagram Q50: Saving-Investment Diagram Q51: Saving-Investment Diagram Unlock this Answer For Free Now! View this answer and more for free by performing one of the following actions Scan the QR code to install the App and get 2 free unlocks Unlock quizzes for free by uploading documents![]()
![]()
![]()
![]()

