Figure 6.1 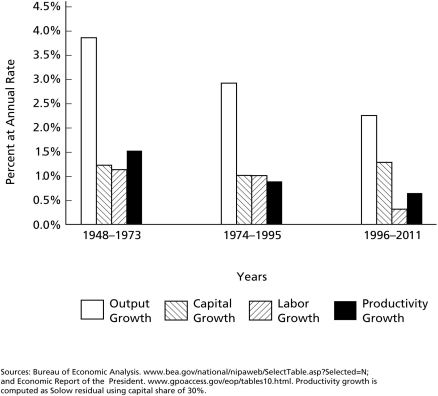
-According to Figure 6.1,the average annual rate of growth of the U.S.economy in the period 1996-2011 equalled ________.
A) 0.3 percent
B) 2.2 percent
C) 30 percent
D) 300 percent
Correct Answer:
Verified
Q57: If productivity is growing at some sustained
Q58: Output per worker is 50,the saving rate
Q59: Population growth is similar to depreciation,in that
Q60: Consumption per worker is 72,depreciation is 12.5%,and
Q61: If productivity growth equals 3.0 percent,the contribution
Q63: In theory,differences in output across economies and
Q64: There are no questions for this section.
6.7
Q65: Figure 6.1 Q66: A major contribution of the Solow model Q67: Figure 6.1 ![]()
![]()
Unlock this Answer For Free Now!
View this answer and more for free by performing one of the following actions

Scan the QR code to install the App and get 2 free unlocks

Unlock quizzes for free by uploading documents