12.2 Equilibrium in Aggregate Demand and Supply Analysis
AD - AS Equilibrium 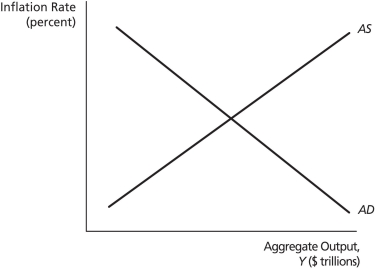
-On the graph above,if output is falling,while the quantity demanded is rising,the economy may be at a point on ________.
A) the aggregate supply curve above the aggregate demand curve
B) the aggregate supply curve below the aggregate demand curve
C) the aggregate demand curve above the aggregate supply curve
D) the aggregate demand curve below the aggregate supply curve
E) none of the above
Correct Answer:
Verified
Q23: The aggregate demand curve is Y =
Q24: If the unemployment rate is above its
Q25: 12.2 Equilibrium in Aggregate Demand and Supply
Q26: Picture an economy that is in general
Q27: 12.2 Equilibrium in Aggregate Demand and Supply
Q29: 12.2 Equilibrium in Aggregate Demand and Supply
Q30: How does the aggregate demand curve differ
Q31: In the AD-AS framework,long-run equilibrium implies that
Q32: How does the aggregate supply curve differ
Q33: If the unemployment rate is above its
Unlock this Answer For Free Now!
View this answer and more for free by performing one of the following actions

Scan the QR code to install the App and get 2 free unlocks

Unlock quizzes for free by uploading documents