The graph below represents a temperature versus energy plot for a pure substance.Identify the point(s) ...(i) where only liquid exists and (ii) is associated with the heat of vaporization 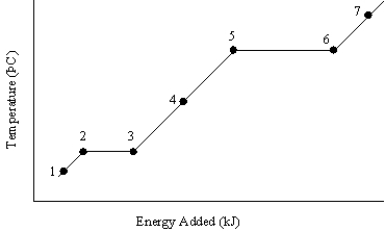
A) (i) 7 (ii) 2 and 3
B) (i) 7 (ii) 5 and 6
C) (i) 4 (ii) 2 and 3
D) (i) 4 (ii) 5 and 6
E) (i) 1 (ii) 5 and 6
Correct Answer:
Verified
Q35: Among the following,identify the incorrect statement about
Q36: What quantity of water will form by
Q37: Calculate the specific heat of an unknown
Q38: Closed system A consists of liquid acetone
Q39: Calculate the heat of vaporization of zinc
Q40: Among the following,identify the sentence that states
Q42: What is the total heat flow if
Q43: The graph below represents a temperature versus
Q44: What is the total heat flow if
Q45: What is the total heat flow if
Unlock this Answer For Free Now!
View this answer and more for free by performing one of the following actions

Scan the QR code to install the App and get 2 free unlocks

Unlock quizzes for free by uploading documents