Multiple Choice
Figure 1.1 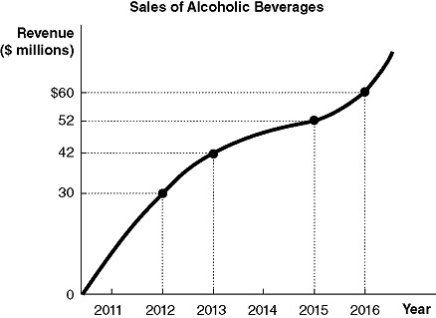
-Refer to Figure 1-1.Using the information in the figure above,calculate the percentage change in revenue from alcoholic beverage sales between 2013 and 2015.
A) 23.8%
B) 40%
C) 42.9%
D) 73.3%
Correct Answer:
Verified
Related Questions
Q198: One example of human capital is the
Q199: What is the difference between accounting profit
Q200: In economics,the total amount received for selling
Q201: If the price of milk was $1.25
Q202: At a recent company meeting,Geraldine Erwin,sales manager
Unlock this Answer For Free Now!
View this answer and more for free by performing one of the following actions

Scan the QR code to install the App and get 2 free unlocks

Unlock quizzes for free by uploading documents