Figure 2-10 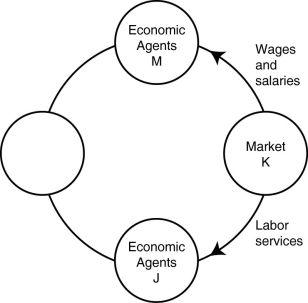
-Refer to Figure 2-10.In the circular flow diagram,market K represents
A) households.
B) product markets.
C) firms.
D) factor markets.
Correct Answer:
Verified
Q178: Suppose that in Belgium,the opportunity cost of
Q179: Table 2-9 Q180: Should countries specialize in producing goods and Q181: The circular flow model demonstrates Q182: Suppose that in the United States,the opportunity Q184: Which of the following is an example Q185: Published in 1776,_ was written by Adam Q186: Firms Q187: Figure 2-10 Q188: When you purchase a new surfboard you
![]()
A)the role of
A)have no influence on the circular flow![]()
Unlock this Answer For Free Now!
View this answer and more for free by performing one of the following actions

Scan the QR code to install the App and get 2 free unlocks

Unlock quizzes for free by uploading documents