The graph below represents the market for alfalfa.The equilibrium price is $7.00 per bushel,but the market price is $9.00 per bushel.Identify the areas representing consumer surplus,producer surplus,and deadweight loss at the equilibrium price of $7.00 and at the market price of $9.00. 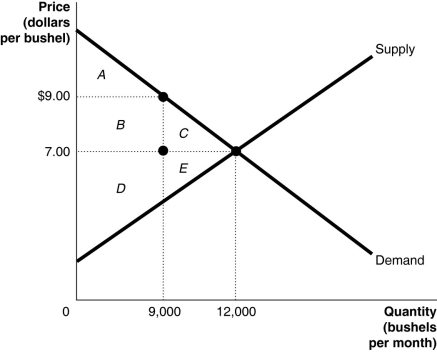
Correct Answer:
Verified
View Answer
Unlock this answer now
Get Access to more Verified Answers free of charge
Q97: If,in a competitive market,marginal benefit is greater
Q98: Economic efficiency is achieved when there is
Q99: In a competitive market when there is
Q100: Figure 4-4 Q101: Table 4-4 Q103: Table 4-4 Q104: Table 4-4 Q105: Table 4-4 Q106: The graph below represents the market for Q107: Table 4-4 Unlock this Answer For Free Now! View this answer and more for free by performing one of the following actions Scan the QR code to install the App and get 2 free unlocks Unlock quizzes for free by uploading documents![]()
![]()
![]()
![]()
![]()
![]()

