Table 4-4
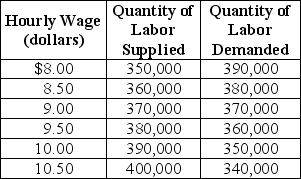 Table 4-4 shows the demand and supply schedules for the low-skilled labor market in the city of Westover.
-Refer to Table 4-4.Suppose that the quantity of labor supplied increases by 40,000 at each wage level.What are the new free market equilibrium hourly wage and the new equilibrium quantity of labor?
A) W = $9.00; Q = 410,000
B) W = $9.50; Q = 420,000
C) W = $8.50; Q = 400,000
D) W = $8.00; Q = 390,000
Correct Answer:
Verified
Q112: Table 4-4 Q113: Table 4-4 Q114: Table 4-4 Q115: When _ in a market,the total net Q116: Table 4-4 Q118: Table 4-4 Q119: Table 4-4 Q120: What is deadweight loss? When is deadweight Q121: Figure 4-6 Q122: _ dictates the lowest wage that firms Unlock this Answer For Free Now! View this answer and more for free by performing one of the following actions Scan the QR code to install the App and get 2 free unlocks Unlock quizzes for free by uploading documents
![]()
![]()
![]()
![]()
![]()
![]()
![]()

