Figure 5-3 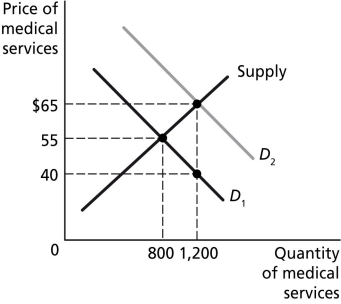 Figure 5-3 represents the market for medical services with and without insurance,and the effect of a third-party payer system on the demand for medical services.
-Refer to Figure 5-3.The efficient quantity of medical services is
A) 400.
B) 800.
C) 1,200.
D) > 1,200.
Correct Answer:
Verified
Q129: Figure 5-3 Q130: Figure 5-3 Q131: Because consumers who have insurance provided by Q132: Due to the trend in U.S.out-of-pocket health Q133: In 2016,_ percent of people enrolled in Q135: Which of the following is not part Q136: Figure 5-3 Q137: Doctors have _ incentive to control their Q138: As a percentage of all spending on Q139: Figure 5-3 Unlock this Answer For Free Now! View this answer and more for free by performing one of the following actions Scan the QR code to install the App and get 2 free unlocks Unlock quizzes for free by uploading documents![]()
![]()
![]()
![]()

