Table 11-3
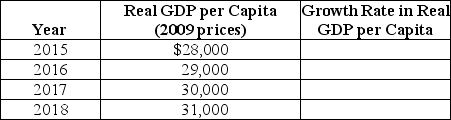
-Refer to Table 11-3.Use the table above to calculate the annual growth rate in GDP.Also calculate the total percentage change in the growth from 2015 through 2018.Explain the difference between the average annual growth rate in real per capita GDP from 2015 through 2018 and the total percentage change in growth from 2015 and 2018.
Correct Answer:
Verified
View Answer
Unlock this answer now
Get Access to more Verified Answers free of charge
Q128: Starting at point B in the diagram
Q129: Describe the process of "creative destruction" using
Q130: The Soviet Union's economic growth rate slowed
Q131: Explain how advances in technology are critical
Q132: Using the points on the diagram below,identify
Q134: Explain how market economies are generally better
Q135: The owner of a firm wants some
Q136: Suggest two policies the government could pursue
Q137: Technological change is the key to sustaining
Q138: Use production functions from the economic growth
Unlock this Answer For Free Now!
View this answer and more for free by performing one of the following actions

Scan the QR code to install the App and get 2 free unlocks

Unlock quizzes for free by uploading documents