Figure 11-5 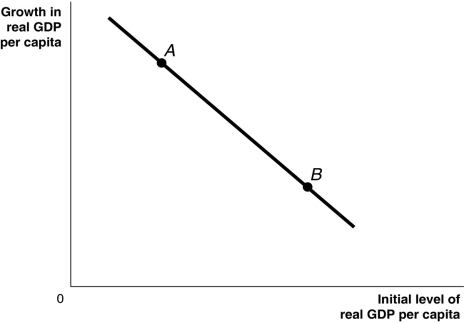
-Refer to Figure 11-5.Based on the "catch-up line" drawn above,poorer countries are more likely to be at a point like ________,where growth in GDP is relatively ________,while richer countries are more likely to be at a point like ________,where growth in GDP is relatively ________.
A) A; low; B; high
B) A; high; B; low
C) B; low; A; high
D) B; high; A; low
Correct Answer:
Verified
Q156: Growth in the United States from 1800
Q157: Because of the productivity slowdown in the
Q158: One of the primary reasons that Mexico
Q159: The rate of growth of productivity in
Q160: Which of the following explains the ability
Q162: According to the World Bank,Albania does one
Q163: The economic growth model predicts that
A)the level
Q164: High-income countries have _ and _ as
Q165: From 1980 to 2016,the average annual growth
Q166: Which of the following can explain why
Unlock this Answer For Free Now!
View this answer and more for free by performing one of the following actions

Scan the QR code to install the App and get 2 free unlocks

Unlock quizzes for free by uploading documents