Figure 13-3 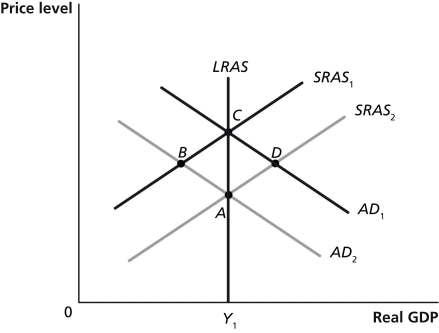
-Refer to Figure 13-3.Which of the points in the above graph are possible long-run equilibria?
A) A and B
B) A and C
C) A and D
D) B and D
Correct Answer:
Verified
Q173: Where the aggregate demand curve and the
Q174: Figure 13-3 Q175: Figure 13-3 Q176: Suppose the economy is at a short-run Q177: Interest rates in the economy have fallen.How Q179: Suppose the economy is at full employment Q180: Why does the short-run aggregate supply curve Q181: Suppose the economy is at a short-run Q182: Suppose the economy is at full employment Q183: On average,in the recessions since 1950,it has![]()
![]()
Unlock this Answer For Free Now!
View this answer and more for free by performing one of the following actions

Scan the QR code to install the App and get 2 free unlocks

Unlock quizzes for free by uploading documents