Figure 13-4 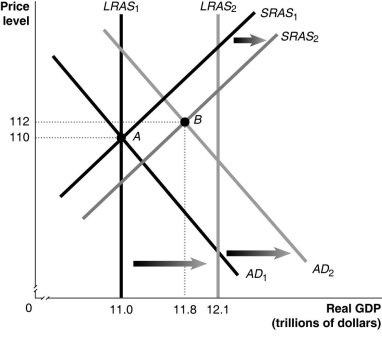
-Refer to Figure 13-4.In the figure above,LRAS1 and SRAS1 denote LRAS and SRAS in year 1,while LRAS2 and SRAS2 denote LRAS and SRAS in year 2.Given the economy is at point A in year 1,what is the growth rate in potential GDP in year 2?
A) 8%
B) 9.1%
C) 10%
D) 12%
Correct Answer:
Verified
Q223: At the beginning of the recession of
Q224: Starting from long-run equilibrium,use the basic aggregate
Q225: Using aggregate demand and aggregate supply,explain what
Q226: Which of the following could explain why
Q227: Starting from long-run equilibrium,use the basic aggregate
Q229: Using the aggregate supply and demand model,illustrate
Unlock this Answer For Free Now!
View this answer and more for free by performing one of the following actions

Scan the QR code to install the App and get 2 free unlocks

Unlock quizzes for free by uploading documents