Figure 15-9 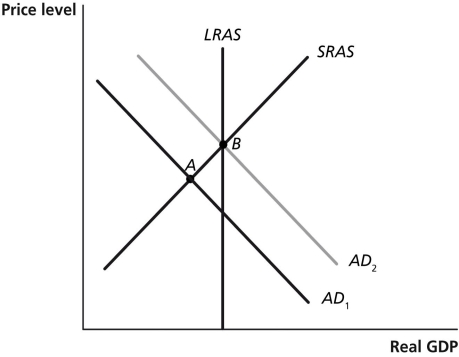
-Refer to Figure 15-9.In the figure above suppose the economy is initially at point A.The movement of the economy to point B as shown in the graph illustrates the effect of which of the following policy actions by the Federal Reserve?
A) a decrease in income taxes
B) an increase in the required reserve ratio
C) an open market purchase of Treasury bills
D) an open market sale of Treasury bills
Correct Answer:
Verified
Q126: Falling interest rates can
A)increase a firm's stock
Q127: Suppose that the economy is producing above
Q128: When the Fed increases the money supply
A)the
Q129: When the Fed embarked on a policy
Q130: If the Fed pursues expansionary monetary policy
A)aggregate
Q132: Which of the following situations is one
Q133: Contractionary monetary policy causes
A)aggregate demand to rise
Q134: If the Fed's policy is contractionary,it will
A)use
Q135: Figure 15-8 Q136: Suppose that the economy is producing below![]()
Unlock this Answer For Free Now!
View this answer and more for free by performing one of the following actions

Scan the QR code to install the App and get 2 free unlocks

Unlock quizzes for free by uploading documents