Figure 16-4 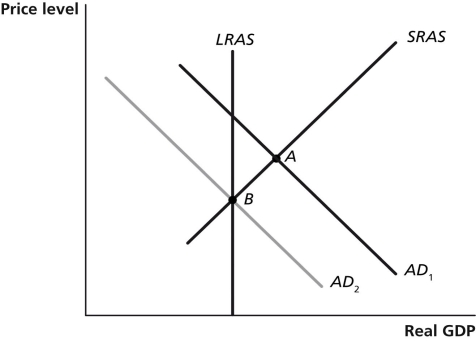
-Refer to Figure 16-4.In the graph above,suppose the economy is initially at point A.The movement of the economy to point B as shown in the graph illustrates the effect of which of the following policy actions by Congress and the president?
A) an increase in transfer payments
B) an increase in interest rates
C) an increase in the marginal income tax rate
D) an open market purchase of Treasury bills
Correct Answer:
Verified
Q66: Contractionary fiscal policy to prevent real GDP
Q67: Decreasing government spending _ the price level
Q68: Lowering the individual income tax rate will
Q69: If the economy is growing beyond potential
Q70: The problem causing most recessions is too
Unlock this Answer For Free Now!
View this answer and more for free by performing one of the following actions

Scan the QR code to install the App and get 2 free unlocks

Unlock quizzes for free by uploading documents