Table 16-5
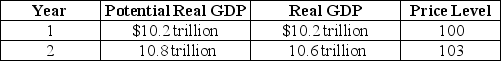
-Refer to Table 16-5.The economy is in the state described by the table above.Draw the dynamic aggregate demand and aggregate supply diagram to illustrate the state of the economy in year 1 and year 2,assuming that no policy is pursued.Then illustrate and explain the appropriate fiscal policy to use in this situation.Assume that the policy results in the economy producing potential GDP.
Correct Answer:
Verified
View Answer
Unlock this answer now
Get Access to more Verified Answers free of charge
Q121: If the tax multiplier is -1.5 and
Q122: The multiplier effect refers to the series
Q123: A change in consumption spending caused by
Q124: The aggregate demand curve will shift to
Q125: Economists refer to the series of induced
Q127: The tax multiplier equals the change in
Q128: Suppose the government spending multiplier is 2.The
Unlock this Answer For Free Now!
View this answer and more for free by performing one of the following actions

Scan the QR code to install the App and get 2 free unlocks

Unlock quizzes for free by uploading documents