Figure 16-11 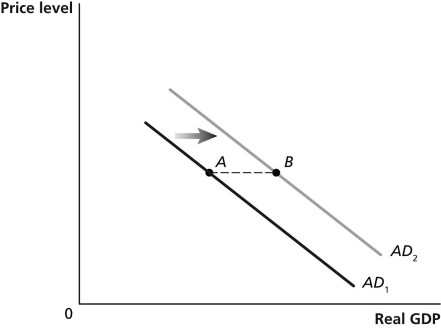
-Refer to Figure 16-11.In the graph above,the shift from AD1 to AD2 represents the total change in aggregate demand.If government purchases increased by $50 billion,then the distance from point A to point B ________ $50 billion.
A) would be equal to
B) would be greater than
C) would be less than
D) may be greater than or less than
Correct Answer:
Verified
Q127: The tax multiplier equals the change in
Q128: Suppose the government spending multiplier is 2.The
Q129: Figure 16-11 Q130: The tax multiplier is smaller in absolute Q131: The government purchases multiplier equals the change Q133: Which of the following would increase the![]()
Unlock this Answer For Free Now!
View this answer and more for free by performing one of the following actions

Scan the QR code to install the App and get 2 free unlocks

Unlock quizzes for free by uploading documents