Figure 17-3 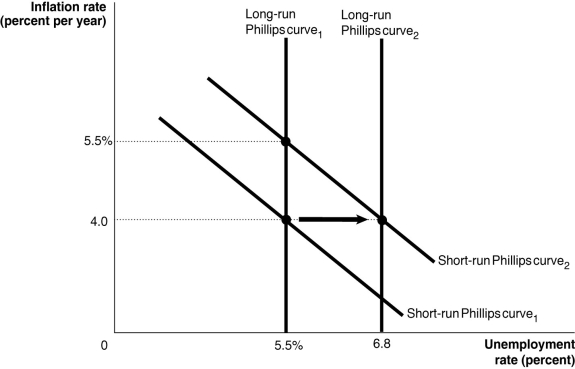
-Refer to Figure 17-3.The shifts shown in the short-run and long-run Phillips curves between period 1 and period 2 could be explained by
A) an increase in the expected inflation rate from 4.0 to 5.5 percent.
B) an increase in the natural rate of unemployment from 5.5 to 6.8 percent.
C) either an increase in expected inflation from 4.0 to 5.5 percent or an increase in the natural rate of unemployment from 5.5 to 6.8 percent.
D) None of the above is correct.
Correct Answer:
Verified
Q103: An increase in the expected inflation rate
Q104: If expected inflation falls,the long-run Phillips curve
Q105: If workers and firms lower their inflation
Q106: The natural rate of unemployment equals
A)the rate
Q107: A "long-run exploitable Phillips curve" refers to
Q109: What can the Federal Reserve do to
Q110: Ceteris paribus,an increase in the current or
Q111: If the Federal Reserve attempts to continue
Q112: An increase in expected inflation will
A)increase real
Q113: What impact does monetary policy have on
Unlock this Answer For Free Now!
View this answer and more for free by performing one of the following actions

Scan the QR code to install the App and get 2 free unlocks

Unlock quizzes for free by uploading documents