This graph demonstrates the domestic demand and supply for a good,as well as a tariff and the world price for that good. 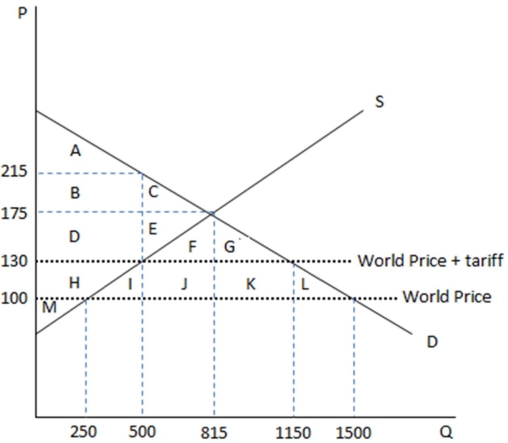
According to the graph shown,the change to government revenue brought about by the imposition of the tariff to an economy once operating under free trade is:
A) an increase of area JK.
B) an increase of area FGJK.
C) an increase of area IJKL.
D) a decrease of area IL.
Correct Answer:
Verified
Q111: This graph demonstrates the domestic demand and
Q112: An import quota is:
A)a limit on the
Q113: This graph demonstrates the domestic demand and
Q114: This graph demonstrates the domestic demand and
Q115: This graph demonstrates the domestic demand and
Q117: This graph demonstrates the domestic demand and
Q118: This graph demonstrates the domestic demand and
Q119: This graph demonstrates the domestic demand and
Q123: Profits earned by foreign firms or governments
Q134: Every government has its own set of
Unlock this Answer For Free Now!
View this answer and more for free by performing one of the following actions

Scan the QR code to install the App and get 2 free unlocks

Unlock quizzes for free by uploading documents