This graph demonstrates the domestic demand and supply for a good,as well as a quota and the world price for that good. 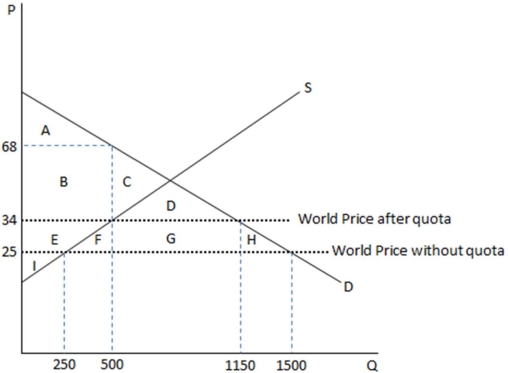
According to the graph shown,the amount bought by domestic consumers when there is open trade for this good is:
A) 1500.
B) 1150
C) 500.
D) 250.
Correct Answer:
Verified
Q96: This graph demonstrates the domestic demand and
Q97: Laws limiting trade are often referred to
Q97: A preference for policies that place limits
Q99: A common tool for restricting trade is:
A)a
Q100: A country that would be a net-exporter
Q102: This graph demonstrates the domestic demand and
Q103: This graph demonstrates the domestic demand and
Q104: This graph demonstrates the domestic demand and
Q105: This graph demonstrates the domestic demand and
Q106: This graph demonstrates the domestic demand and
Unlock this Answer For Free Now!
View this answer and more for free by performing one of the following actions

Scan the QR code to install the App and get 2 free unlocks

Unlock quizzes for free by uploading documents