This graph demonstrates the domestic demand and supply for a good,as well as a quota and the world price for that good. 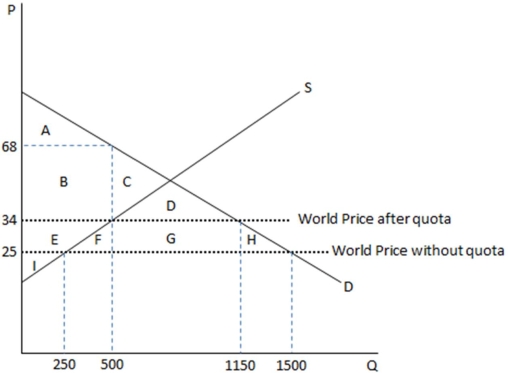
Once an economy decides to impose a quota,as is the case in the graph shown,the outcome differs from that of a tariff being imposed in that:
A) area G represents quota rents instead of tax revenues.
B) area F and H are deadweight loss instead of transferred surplus.
C) area E represents tax revenues instead of transferred surplus.
D) None of these is true.
Correct Answer:
Verified
Q133: The problem of inconsistent standards across nations
Q133: Every government's set of policies used to
Q134: The effect of quotas is:
A)to drive up
Q135: As a general rule,free trade:
A)increases demand for
Q136: As a general rule,free trade:
A) acts to
Q136: When a nation imposes a blanket standard
Q139: This graph demonstrates the domestic demand and
Q141: The restriction or prohibition of trade in
Q142: Import standards on specific countries usually address
Q143: The fair trade movement:
A)attempts to inform and
Unlock this Answer For Free Now!
View this answer and more for free by performing one of the following actions

Scan the QR code to install the App and get 2 free unlocks

Unlock quizzes for free by uploading documents