This table represents the revenues faced by a monopolist. 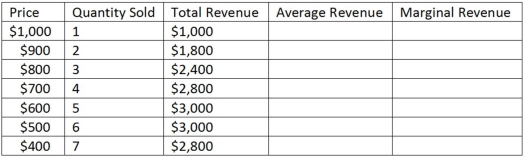
Using the information in the table shown,if you were to graph the first two columns,you would have graphed which curve?
A) Marginal revenue
B) Market supply
C) Market demand
D) Total productivity
Correct Answer:
Verified
Q44: This table represents the revenues faced by
Q45: This table represents the revenues faced by
Q46: This table represents the revenues faced by
Q48: When a monopolist increases output,total revenue:
A)will increase
Q50: This table represents the revenues faced by
Q51: If a monopoly wishes to sell more
Q52: This table represents the revenues faced by
Q53: Total revenue decreases as output increases when
Q54: For a monopolist,marginal revenue for all units
Q56: For a monopolist,the price effect:
A) is the
Unlock this Answer For Free Now!
View this answer and more for free by performing one of the following actions

Scan the QR code to install the App and get 2 free unlocks

Unlock quizzes for free by uploading documents