This graph shows the cost and revenue curves faced by a monopoly. 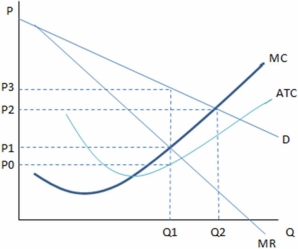
According the graph shown,the profit-maximizing decision of the monopolist would be:
A) Q1,P1.
B) Q1,P3.
C) Q2,P2.
D) This monopolist should not enter the market.
Correct Answer:
Verified
Q68: For a monopoly, when marginal revenue is
Q81: The equilibrium price and quantity in a
Q81: This graph shows the cost and revenue
Q83: The presence of a monopoly helps:
A)producers.
B)consumers.
C)society overall.
D)All
Q84: For markets operating at quantities lower than
Q86: The public policies designed to mitigate the
Q87: The existence of a monopoly:
A)creates a gain
Q88: The monopolist chooses to produce:
A)where marginal cost
Q89: This graph shows the cost and revenue
Q90: This graph shows the cost and revenue
Unlock this Answer For Free Now!
View this answer and more for free by performing one of the following actions

Scan the QR code to install the App and get 2 free unlocks

Unlock quizzes for free by uploading documents