This graph shows the cost and revenue curves faced by a monopoly. 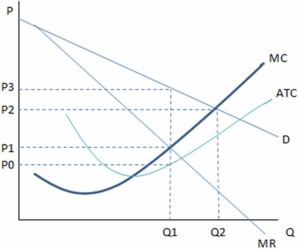
According to the graph shown,the profit being earned by this monopolist is:
A) (P3 - P0) x Q1
B) (P3 - P1) x Q1
C) (P1 - P0) x Q1
D) (P3 - P0) /Q1
Correct Answer:
Verified
Q64: The monopolist is able to enjoy profits
Q87: The existence of a monopoly:
A)creates a gain
Q88: The monopolist chooses to produce:
A)where marginal cost
Q89: This graph shows the cost and revenue
Q90: This graph shows the cost and revenue
Q91: One reason DeBeers has lost some of
Q93: The existence of a monopoly:
A) creates market
Q94: This graph shows the cost and revenue
Q95: The monopolist's outcome happens at a:
A)lower price
Q97: The presence of a monopoly:
A)hurts consumers.
B)hurts society
Unlock this Answer For Free Now!
View this answer and more for free by performing one of the following actions

Scan the QR code to install the App and get 2 free unlocks

Unlock quizzes for free by uploading documents