This graph depicts the demand for a normal good. 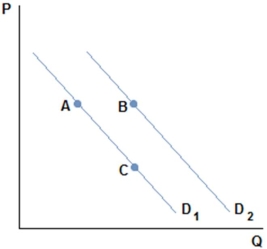
A movement from A to B in the graph shown might be caused by:
A) a decrease in the price of a substitute.
B) a decrease in the price of a complement.
C) an increase in the price of a complement.
D) an increase in the good's price.
Correct Answer:
Verified
Q37: Jan heads to the store to buy
Q43: Apple just announced it will be coming
Q61: The city of Burlington is a very
Q62: This graph depicts the demand for a
Q63: Darren loves to go to the movies,and
Q65: Tom was out shopping for a sweater
Q66: Which of the following would not affect
Q67: What happens to the demand curve when
Q68: There has been an increase in the
Q69: The baby boomer generation is just starting
Unlock this Answer For Free Now!
View this answer and more for free by performing one of the following actions

Scan the QR code to install the App and get 2 free unlocks

Unlock quizzes for free by uploading documents