Examine the following graph.This graph shows that the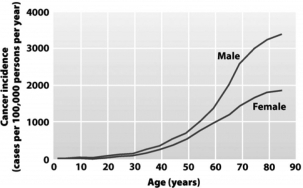
A) rate of cancer diagnosis increases for both genders with increasing age.
B) mortality rate for cancer increases more rapidly in older men than in older women.
C) probability of acquiring cancer for both genders becomes greater than 50 percent after age 80.
D) majority of individuals living to age 80 or beyond will be diagnosed with cancer.
Correct Answer:
Verified
Q1: As indicated in the following diagram,the
Q2: Examine the following diagram.Which is most likely
Q3: A woman who has already had children
Q6: As an individual ages,cancer risk increases over
Q8: Rapid cell proliferation can result from
A) contact
Q9: Which of the following is NOT true
Q11: Normal cellular genes that can be mutated
Q11: Examine the following diagram.Which is most likely
Q15: A tumor that has gained the ability
Q19: For cancer to form in the presence
Unlock this Answer For Free Now!
View this answer and more for free by performing one of the following actions

Scan the QR code to install the App and get 2 free unlocks

Unlock quizzes for free by uploading documents