The following graph shows the growth of a Paramecium population.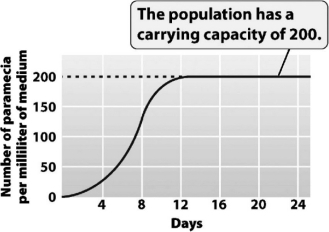
The greatest amount of daily growth occurred when the population was at approximately ________ percent of its carrying capacity.
A) 10
B) 25
C) 50
D) 100
Correct Answer:
Verified
Q26: When an isolated population reaches its carrying
Q27: Which of the following situations illustrates a
Q28: Biologists estimate that the human population on
Q36: The effects of pollution are generally considered
Q37: The top of the "S" in an
Q41: The type of growth that occurs when
Q42: A group of interacting individuals of the
Q53: Because of its shape,the curve describing population
Q55: When the combination of death and emigration
Q58: Once a population reaches its carry capacity,its
Unlock this Answer For Free Now!
View this answer and more for free by performing one of the following actions

Scan the QR code to install the App and get 2 free unlocks

Unlock quizzes for free by uploading documents