Examine the following graph;what best describes the cycling that each population experiences?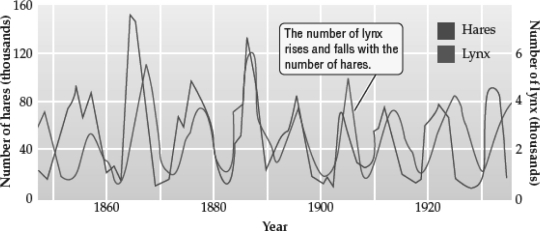
A) Lynx populations decrease in size when hare populations increase in size;hares are the superior competitors.
B) Lynx populations increase in size when hare populations decrease in size;lynx are the superior competitors.
C) Lynx populations decrease in size when hare populations decrease in size;lynx are exploiting the hare population.
D) The increase and decrease of each species is driven by oscillating density-independent factors,but since they share the same habitat,the cycles coincide.
Correct Answer:
Verified
Q22: Which of the following is most likely
Q24: Which of the following patterns represents the
Q25: Which of the following patterns represents a
Q27: In the centers of their ranges,two species
Q28: Which of the following patterns represents the
Q31: Which of the following statements is FALSE?
A)
Q32: Some species of warblers partition their niche
Q33: When two similar species inhabit the same
Q35: A praying mantis captures and devours many
Q38: Herbivores interact exploitatively with the plants they
Unlock this Answer For Free Now!
View this answer and more for free by performing one of the following actions

Scan the QR code to install the App and get 2 free unlocks

Unlock quizzes for free by uploading documents